
Service Details
BigBlueButton Analytics
See who attended, who took part, and how your classes run
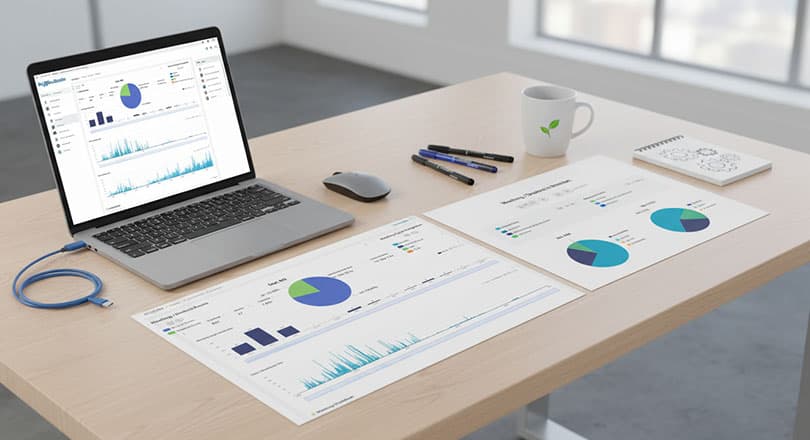
Turn your classes into insight
BigBlueButton Analytics shows what happens in your virtual classrooms: how many sessions ran, who attended, how long each person stayed, who spoke, who wrote in the chat and who answered the polls. Each session is processed automatically after it ends and added to your history, so you follow activity day by day and month by month.
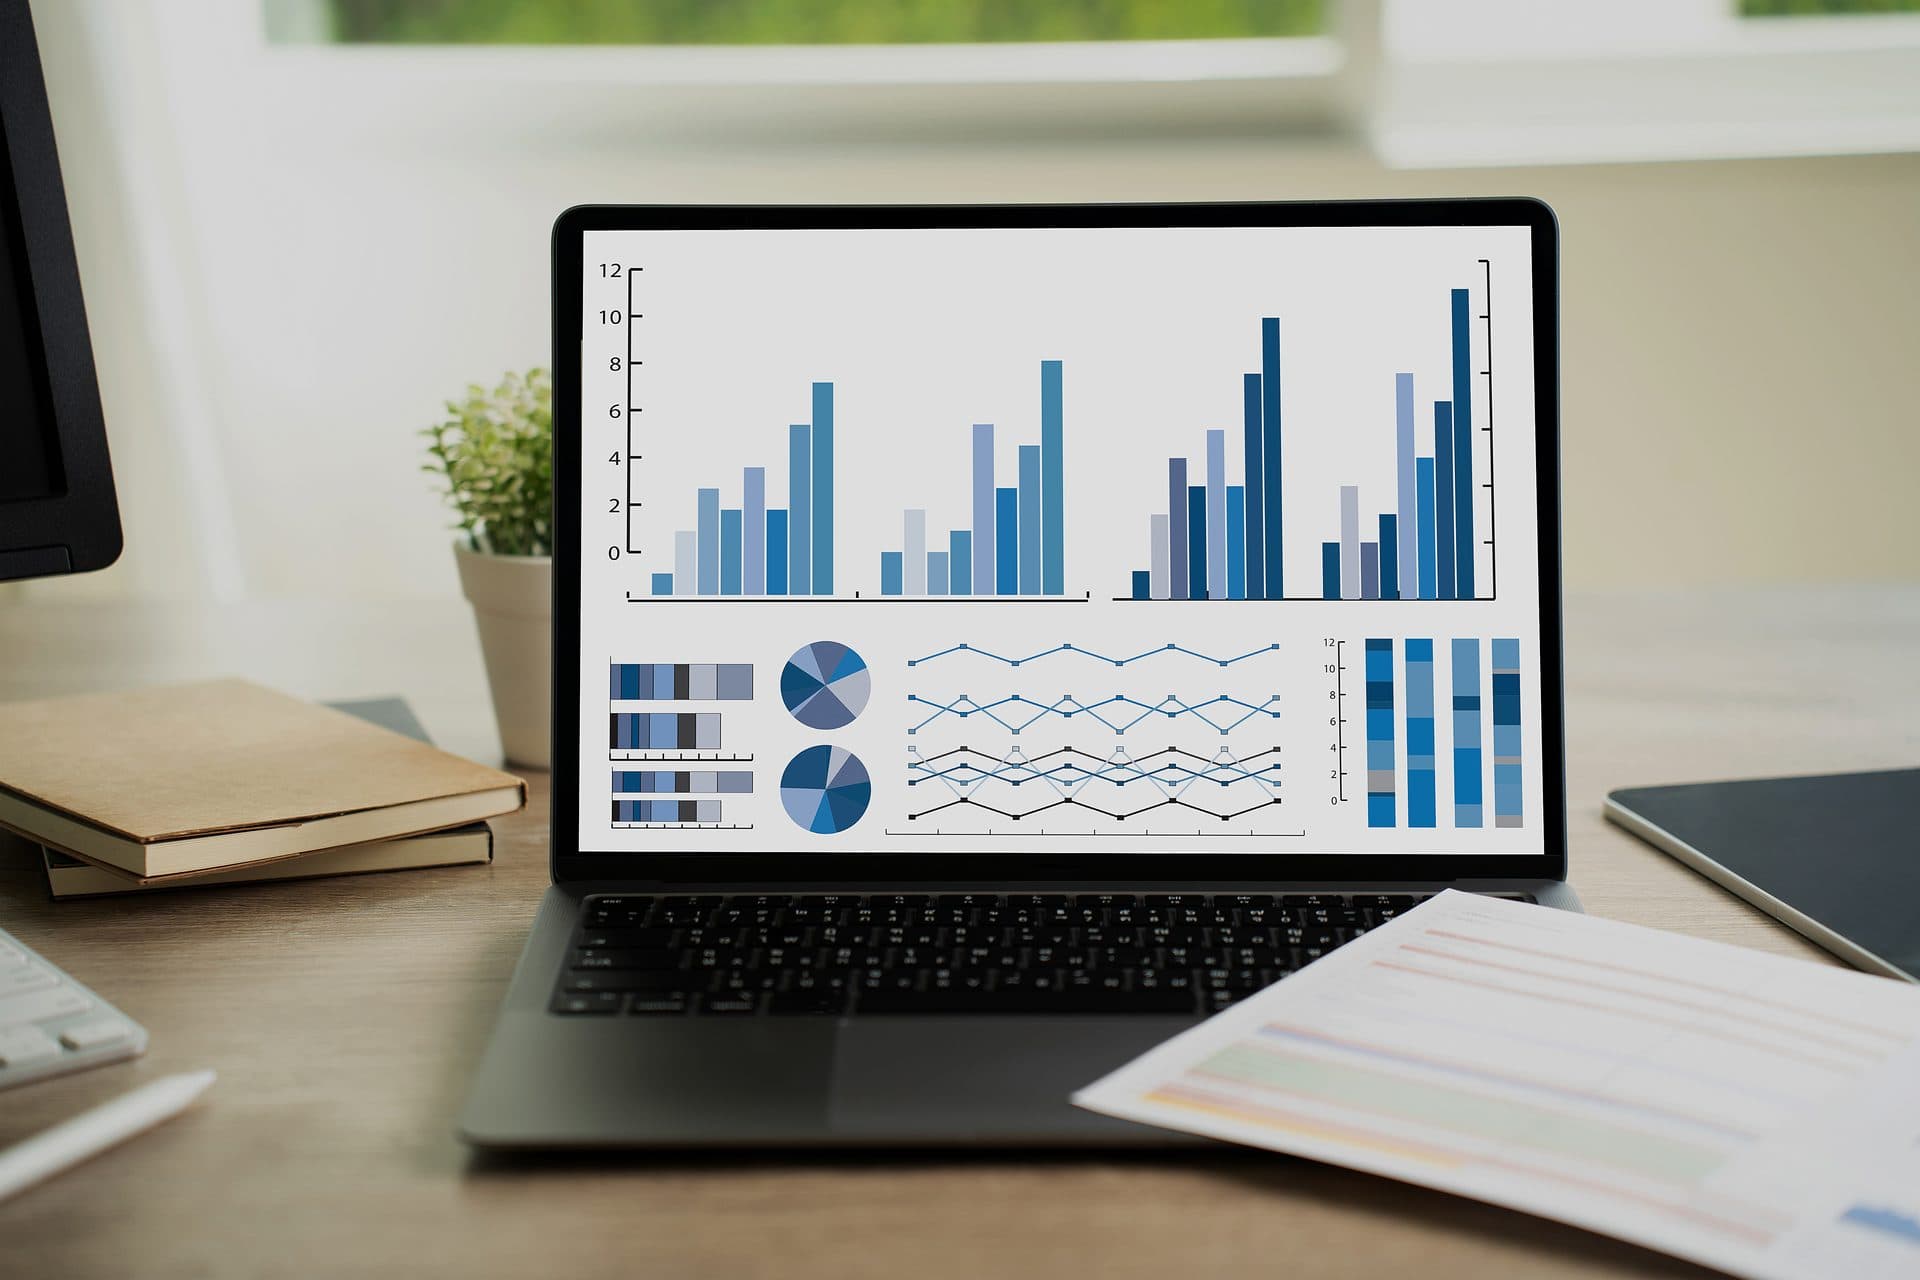
Clear dashboards, one topic each
The overview gives the totals at a glance: sessions, participants, total and average session time, the longest session and the average number of sessions per day. It also charts participants and sessions per day, how session lengths are spread, and the share of breakout rooms. Further dashboards cover attendance, chat, polling, audio, whiteboard and presentations, and the use of classroom tools.
Talk to the engineers behind BigBlueButton Analytics
A first conversation is free. Tell us what you run and what you need, and we will say plainly whether we are the right team.

Attendance and participation, person by person
The attendance table lists each participant in each session with presence time, talk time, webcam time, screen-sharing time, chat messages, poll responses and an activity score. Search by name to follow one learner across sessions. A role chart splits attendance between teachers and students, and a counter shows the sessions nobody joined.
Chat, polls and whiteboard
Chat figures give the number of public messages, the average per session and per participant, and a monthly trend. Polling figures give the number of polls and answers, the poll types used, the share of polls that received an answer, the average time to the first answer and the average poll length. Whiteboard figures give the presentations uploaded, the average per session, pointer activity per day and how often the whiteboard is cleared.
A heatmap shows when sessions take place by weekday and hour, a calendar shows sessions month by month, and a word cloud shows the most frequent words in session names. A tool usage chart gives the share of sessions that used presentations, chat, shared videos and the whiteboard.
Filter, drill down, export
Filter by date range, session name, session ID, participant name, number of participants or number of shared videos. Click a slice of a chart to filter the rest of the dashboard, and open the records behind any figure. Session tables are searchable and show each session's name, date, breakout status and the meeting ID your learning platform assigned. Sessions are also grouped by the application that created them. Export chart data to CSV or Excel, and save a dashboard as a PDF or an image.
Why choose RIADVICE analytics
Attendance you can check
Presence, talk, webcam and screen-sharing time for each participant in each session.
Activity scores
Each learner's talk time, chat, raised hands, reactions and poll answers, compared with the most active learner in the same session.
Dashboards by topic
Overview, attendance, chat, polling, audio, whiteboard and presentations, and classroom tool usage.
Filters and drill-down
Narrow by date, session or participant, click a chart to filter the rest of the page, and open the records behind a figure.
Exports
Chart data to CSV or Excel, and whole dashboards to PDF or image.
Insight you can act on
Want to see what happens in your classes?
As a BigBlueButton Certified Service Provider, RIADVICE turns the activity data of your sessions into clear dashboards for administrators and teaching teams.